Tag Archives: News

Alexis Rossi announced as RFC Series Consulting Editor

Alexis Rossi, the Director of Media & Access at the Internet Archive, was announced yesterday as the new RFC Series Consulting Editor for the Internet Engineering Task Force (IETF).

The RFC Series contains documents that define how the Internet functions. The first RFC was published in 1969, when just a few organizations were trying to figure out how to communicate digitally. Now, 53 years later, more than 9,200 RFCs have been written by thousands of volunteers and these documents and protocols are the underpinnings of the Internet systems we use every day.

Alexis joins the IETF team to help maintain the archival quality of the RFC Series, and to provide guidance on the policies and processes for publishing these important documents. She will also continue in her role with the Internet Archive, managing the organization’s millions of digital items.

The Internet Archive’s founder, Brewster Kahle, who has his own informational RFC (RFC 1625) published in 1994 for WAIS (Wide Area Information Servers), said of Alexis’s new role, “From my own days working on WAIS, I know how important these documents have been to the development of today’s Web. I’m glad to know that someone with so much experience will be helping to keep this Series preserved.”

We wish Alexis well in her new endeavor!

Radio Ngrams Dataset Allows New Research into Public Health Messaging

Guest post by Dr. Kalev Leetaru

Radio remains one of the most-consumed forms of traditional media today, with 89% of Americans listening to radio at least once a week as of 2018, a number that is actually increasing during the pandemic. News is the most popular radio format and 60% of Americans trust radio news to “deliver timely information about the current COVID-19 outbreak.”

Local talk radio is home to a diverse assortment of personality-driven programming that offers unique insights into the concerns and interests of citizens across the nation. Yet radio has remained stubbornly inaccessible to scholars due to the technical challenges of monitoring and transcribing broadcast speech at scale.

Debuting this past July, the Internet Archive’s Radio Archive uses automatic speech recognition technology to transcribe this vast collection of daily news and talk radio programming into searchable text dating back to 2016, and continues to archive and transcribe a selection of stations through present, making them browsable and keyword searchable.

Ngrams data set

Building on this incredible archive, the GDELT Project and I have transformed this massive archive into a research dataset of radio news ngrams spanning 26 billion English language words across portions of 550 stations, from 2016 to the present.

You can keyword search all 3 million shows, but for researchers interested in diving into the deeper linguistic patterns of radio news, the new ngrams dataset includes 1-5grams at 10 minute resolution covering all four years and updated every 30 minutes. For those less familiar with the concept of “ngrams,” they are word frequency tables in which the transcript of each broadcast is broken into words and for each 10 minute block of airtime a list is compiled of all of the words spoken in those 10 minutes for each station and how many times each word was mentioned.

Some initial research using these ngrams

How can researchers use this kind of data to understand new insights into radio news?

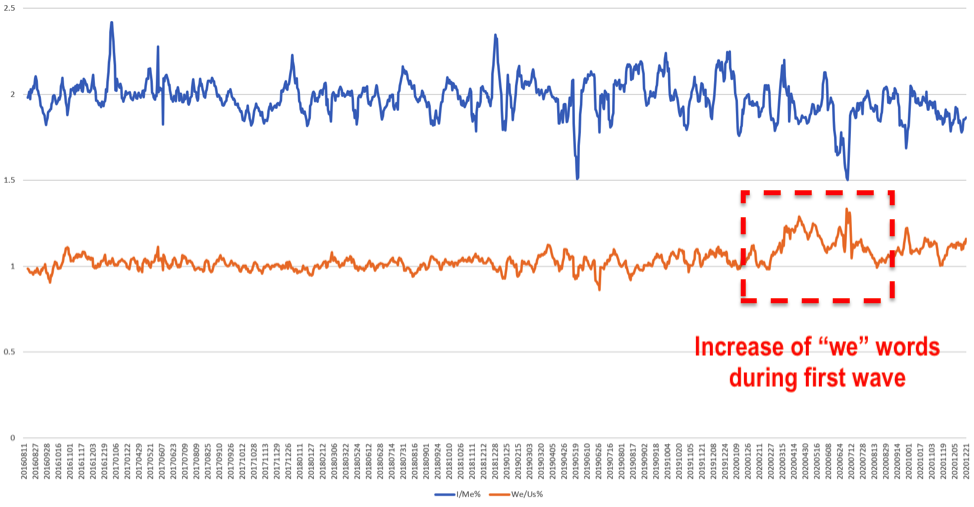
The graph below looks at pronoun usage on BBC Radio 4 FM, comparing the percentage of words spoken each day that were either (“we”, “us”, “our”, “ours”, “ourselves”) or (“i”, “me”, “i’m”). “Me” words are used more than twice as often as “we” words but look closely at February of 2020 as the pandemic began sweeping the world and “we” words start increasing as governments began adopting language to emphasize togetherness.

“We” (orange) vs. “Me” (blue) words on BBC Radio 4 FM, showing increase of “we” words beginning in February 2020 as Covid-19 progresses

TV vs. Radio

Combined with the television news ngrams that I previously created, it is possible to compare how topics are being covered across television and radio.

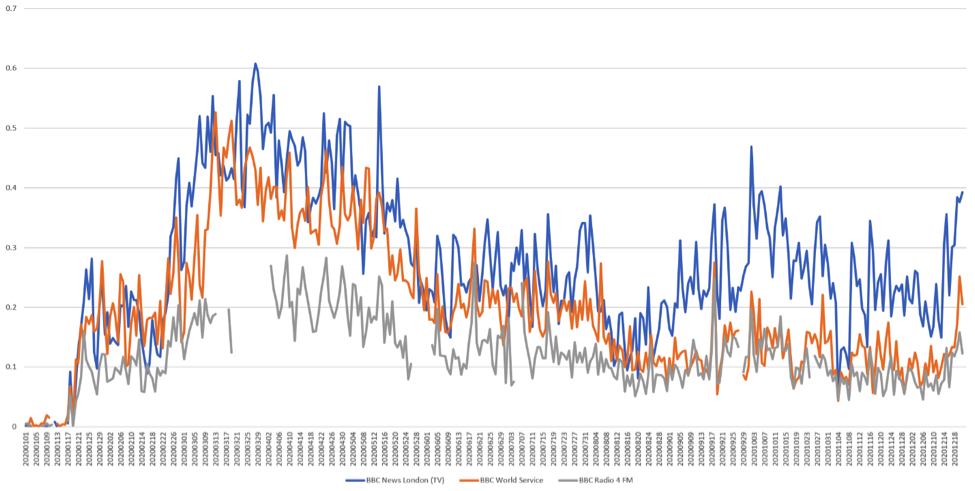
The graph below compares the percentage of spoken words that mentioned Covid-19 since the start of this year across BBC News London (television) versus radio programming on BBC World Service (international focus) and BBC Radio 4 FM (domestic focus).

All three show double surges at the start of the year as the pandemic swept across the world, a peak in early April and then a decrease since. Yet BBC Radio 4 appears to have mentioned the pandemic far less than the internationally-focused BBC World Service, though the two are now roughly equal even as the pandemic has continued to spread. Over all, television news has emphasized Covid-19 more than radio.  

Covid-19 mentions on Television vs. Radio. The chart compares BBC News London (TV) in blue, versus BBC World Service (Radio) in orange and BBC Radio 4 FM (Radio) in grey.

For now, you can download the entire dataset to explore on your own computer but there will also be an interactive visualization and analysis interface available sometime in mid-Spring.

It is important to remember that these transcripts are generated through computer speech recognition, so are imperfect transcriptions that do not properly recognize all words or names, especially rare or novel terms like “Covid-19,” so experimentation may be required to yield the best results.

The graphs above just barely scratch the surface of the kinds of questions that can now be explored through the new radio news ngrams, especially when coupled with television news and 152-language online news ngrams.

From transcribing 3 million radio broadcasts into ngrams to describing a decade of television news frame by frame, cataloging the objects and activities of half a billion online news images, to inventorying the tens of billions of entities and relationships in half a decade of online journalism, it is becoming increasingly possible to perform multimodal analysis at the scale of entire archives.

Researchers can ask questions that for the first time simultaneously look across audio, video, imagery and text to understand how ideas, narratives, beliefs and emotions diffuse across mediums and through the global news ecosystem. Helping to seed the future of such at-scale research, the Internet Archive and GDELT are collaborating with a growing number of media archives and researchers through the newly formed Media Data Research Consortium to better understand how critical public health messaging is meeting the challenges of our current global pandemic.

About Kalev Leetaru

For more than 25 years, GDELT’s creator, Dr. Kalev H. Leetaru, has been studying the web and building systems to interact with and understand the way it is reshaping our global society. One of Foreign Policy Magazine’s Top 100 Global Thinkers of 2013, his work has been featured in the presses of over 100 nations and fundamentally changed how we think about information at scale and how the “big data” revolution is changing our ability to understand our global collective consciousness.

Archiving Online Local News with the News Measures Research Project

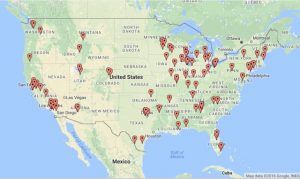
Over the past two years Archive-It, Internet Archive’s web archiving service, has partnered with researchers at the Hubbard School of Journalism and Mass Communication at University of Minnesota and the Dewitt Wallace Center for Media and Democracy at Duke University in a project designed to evaluate the health of local media ecosystems as part of the News Measures Research Project, funded by the Democracy Fund. The project is led by Phil Napoli at Duke University and Matthew Weber at University of Minnesota. Project staff worked with Archive-It to crawl and archive the homepages of 663 local news websites representing 100 communities across the United States. Seven crawls were run on single days from July through September and captured over 2.2TB of unique data and 16 million URLs. Initial findings from the research detail how local communities cover core topics such as emergencies, politics and transportation. Additional findings look at the volume of local news produced by different media outlets, and show the importance of local newspapers in providing communities with relevant content. 

The goal of the News Measures Research Project is to examine the health of local community news by analyzing the amount and type of local news coverage in a sample of community. In order to generate a random and unbiased sample of communities, the team used US Census data. Prior research suggested that average income in a community is correlated with the amount of local news coverage; thus the team decided to focus on three different income brackets (high, medium and low) using the Census data to break up the communities into categories. Rural areas and major cities were eliminated from the sample in order to reduce the number of outliers; this left a list of 1,559 communities ranging in population from 20,000 to 300,000 and in average household income from $21,000 to $215,000. Next, a random sample of 100 communities was selected, and a rigorous search process was applied to build a list of 663 news outlets that cover local news in those communities (based on Web searches and established directories such as Cision).

The News Measures Research Project web captures provide a unique snapshot of local news in the United States. The work is focused on analyzing the nature of local news coverage at a local level, while also examining the broader nature of local community news. At the local level, the 100 community sample provides a way to look at the nature of local news coverage. Next, a team of coders analyzed content on the archived web pages to assess what is being covered by a given news outlet. Often, the websites that serve a local community are simply aggregating content from other outlets, rather than providing unique content. The research team was most interested in understanding the degree to which local news outlets are actually reporting on topics that are pertinent to a given community (e.g. local politics). At the global level, the team looked at interaction between community news websites (e.g. sharing of content) as well as automated measures of the amount of coverage.

The primary data for the researchers was the archived local community news data, but in addition, the team worked with census data to aggregate other measures such as circulation data for newspapers. These data allowed the team to examine the amount and type of local news changes depending on the characteristics of the community. Because the team was using multiple datasets, the Web data is just one part of the puzzle. The WAT data format proved particularly useful for the team in this regard. Using the WAT file format allowed the team to avoid digging deeply into the data – rather, the WAT data allowed the team to examine high level structure without needing to examine the content of each and every WARC record. Down the road, the WARC data allows for a deeper dive,  but the lighter metadata format of the WAT files has enabled early analysis.

Stay tuned for more updates as research utilizing this data continues! The websites selected will continue to be archived and much of the data are publicly available.

From Spicer to wiretapping to Sweden: does TV news fuel political rhetoric?

Cross posted from MediaShift.

A few hours after after Sean Spicer, the White House press secretary, compared Syrian President Bashar Assad to Adolf Hitler, saying, “We didn’t use chemical weapons in World War II…You had … someone as despicable as Hitler who didn’t even sink to using chemical weapons,” the media speculation began. Where did Spicer get the idea to compare Assad to Hitler?

On Twitter, a liberal blogger named Yashar Ali pointed to a Fox News segment that had aired on April 10, featuring a Skype interview with Kassim Eid, a Syrian activist who has written about surviving an earlier gas attack, seen below on the TV News Archive. Eid said, “He displaced half of the country. He destroyed the country. He gassed women and children. Who can be worse than him? He’s worse than Hitler.”

Ali’s tweet was picked up later that afternoon by NJ.com in a report about the social media criticism following Spicer’s statement. At 4:50 p.m., Charlie Warzel, a reporter for BuzzFeed, posted a piece hypothesizing that the Fox Business News interview might have been the inspiration for Spicer’s statement.

Of course only Spicer himself knows if the Fox News report inspired his statement, which he eventually apologized for after several hours of harsh criticism. After all, he is certainly not the first public official to run into trouble when making statements about Hitler.
In an era where news no longer solely arrives on newsprint on front doorsteps, tracing the provenance of a statement, idea, story, or report across media platforms–social media, television, news websites–has become a common pursuit. This has been, perhaps, fueled by the president, who has made such references himself.

As a library, the Internet Archive can help. Our Wayback Machine preserves websites online, with more than 286 million websites saved overtime. And our TV News Archive provides an online, public library with 1.3 million shows and counting. Here we have the original source for many types of statements by public officials: news conferences, appearances before congressional committees, appearances on TV news shows, and more. The 60-second segment format allows for editing your own clips up to three minutes long and makes them shareable on social media and embeddable on websites.

For example, in February, Trump made a reference at a Florida rally about Sweden: “Look at what’s happening last night in Sweden. Sweden, who would believe this? Sweden. They took in large numbers. They’re having problems like they never thought possible.” Fact- checkers reported that nothing had happened in Sweden the night before.

Trump later tweeted, however, that his statement about Swedish problems was inspired by Fox News report.

In that report, Fox showed an interview by a Swedish film maker, Ami Horowitz, who asserts that refugees are responsible for “an absolute surge in both gun violence and rape in Sweden once they began this open door policy.”

Robert Farley, a reporter for FactCheck.org, wrote that this claim is contested by “Swedish authorities and criminologists.”

Several weeks later, Trump credited a “talented legal mind” on Fox news as the source for his March 2017 tweet accusing former President Barack Obama ordering wiretapping of Trump tower during the presidential election.

Following Trump’s statement, Shepard Smith, chief news anchor for Fox News, said that “Fox News cannot confirm Judge Napalitano’s commentary. Fox News knows of no evidence of any kind that the president of the united states was surveilled at any time in any way, full stop.”

The question of how political rhetoric travels across media platforms goes far beyond the Trump administration. Media researchers are developing methodologies to track messages and stories as they travel across the news ecosphere. Understanding these phenomenon is essential in figuring out effective ways to improve overall media literacy and fight the spread of misinformation.

As an early experiment in making such research easier, we’ve been developing hand-curated collections of statements by public officials, starting with the Trump Archive and now branching out to creating archives (still in development) for the congressional leadership on both sides of the party aisle: Sen. Majority Leader Mitch McConnell, R., Ky.; Senate Minority Leader Charles Schumer, D., N.Y.; House Speaker Paul Ryan, R., Wis., and House Minority Leader Nancy Pelosi, D., Calif.

We’re working now to develop partnerships to use machine learning approaches, such as speaker identification and natural language processing, to make our resources more useful for researchers. Ultimately, we’ll improve search to make it simpler to search across our different collections and types of media.
Get your Dem debate visualizations here

Hot off the internet presses, here is media analyst’s Kalev Leetaru’s visualization tool, fueled by Internet Archive data, which enables users to trace particular phrases used in broadcast news coverage in the first 24 hours after would-be presidential nominees appeared in the first Democratic debate of the 2016 election.

Scroll down and what sticks out immediately are the two subjects that captured most of the news broadcasters’ attention: “Bernie Sanders’ “damn emails” quote and guns.

When the subject came up of the controversy over Clinton’s decision to do public work from a private email server, rather than attack Clinton, Sanders defended her:

“Let me say — let me say something that may not be great politics. But I think the secretary is right, and that is that the American people are sick and tired of hearing about your damn e-mails.”

According to Internet Archive data, that sound bite aired 496 times across stations.

The other issue that grabbed attention was gun violence: Sanders, who hails from gun-friendly rural Vermont, was called to task for his vote to make it tougher to hold gun manufacturers liable when the guns they make are used in a crime. Answering a question by CNN moderator Anderson Cooper, on whether Sanders is tough enough on guns, Clinton said:

“No, not at all. I think that we have to look at the fact that we lose 90 people a day from gun violence. This has gone on too long and it’s time the entire country stood up against the NRA. The majority of our country…(APPLAUSE)… supports background checks, and even the majority of gun owners do.”

This clip aired 260 times across stations.

However, these are just the top take-aways from this massive data crunching tool. It provides a search mechanism for the user to do deeper dives into the data and discover trends across and within certain types of news broadcasts.

Leetaru’s own analysis is here, on the Washington Post’s Monkey Cage. Among his observations:

There was also variation in how much attention each network paid to each candidate (you can see for yourself using the interactive visualization). Telemundo favored Sanders with 41 percent, followed by O’Malley with 24 percent and Clinton at just 21 percent, though admittedly, they broadcast a relatively small number of excerpts. FOX Business also favored Sanders 50 percent to Clinton’s 38 percent, as did CSPAN with Sanders at 52 percent to Clinton’s 44 percent. All other networks favored Clinton, though sometimes by a relatively close margin — like CNBC (50 percent Clinton to 43 percent Sanders) or PBS affiliates (41 percent Clinton to 38 percent Sanders).

This tool is also part of the Internet Archive’s testing of technology that we’ll use in our new Knight Foundation funded project to track political TV ads in key primary states, which will launch in early December.

Dig in and have fun.