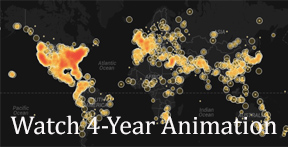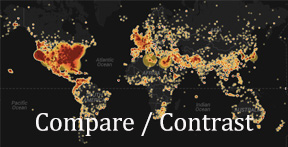
We are excited to unveil a couple experimental data-driven visualizations that literally map 400,000 hours of U.S. television news. One of our collaborating scholars, Kalev Leetaru, applied “fulltext geocoding” software to our entire television news research service collection. These algorithms scan the closed captioning of each broadcast looking for any mention of a location anywhere in the world, disambiguate them using the surrounding discussion (Springfield, Illinois vs Springfield, Massachusetts), and ultimately map each location. The resulting CartoDB visualizations provide what we believe is one of the first large-scale glimpses of the geography of American television news, beginning to reveal which areas receive outsized attention and which are neglected.
Watch TV news mentions of places throughout the world for each day.
Select a TV station and time window to view their representations of places.
Keep in mind that as you explore, zoom-in and click the locations in these pilot maps, you are going to find a lot of errors. Those range from errors in the underlying closed captioning (“two Paris of shoes”) to locations that are paired with onscreen information (a mention of “Springfield” while displaying a map of Massachusetts on the screen). Thus, as you click around, you’re going to find that some locations work great, while others have a lot more error, especially small towns with common names.
What you see here represents our very first experiment with revealing the geography of television news and required bringing together a bunch of cutting-edge technologies that are still very much active areas of research. While there is still lots of work to be done, we think this represents a tremendously exciting prototype for new ways of interacting with the world’s information by organizing it geographically and putting it on a map where it belongs!
Virtual Machines: Unlocking Media for Research
In addition to our public web-based research service, we are facilitating scholars, like Kalev, and other researchers in applying advanced data treatments to our entire collection, at a speed and scale beyond any individual’s capacity. As responsible custodians of an enormous collection of television news content created by others, we endeavor to secure their work within the context of our library. Therefore, rather than lending out copies of large portions of the collection for study, researchers instead work in our “virtual reading room” where they may run their computer algorithms on our servers within the physical confines of the Archive. We hope our evolving demonstrations of this data queries in — results out — process may help forge a new model for how exceptional public interest value can be derived from media without challenging their value and integrity to their creators.
The Knight Foundation and other insightful donors are providing critical support in our ongoing efforts to open television news and join with others in re-visioning how digital libraries can respectfully address the educational potential of other diverse media. We hope you will consider lending your support.


Pingback: Mapping 400,000 Hours of U.S. TV News | Library Stuff
Great project! It’s wonderful to see what you’ve done with all this available data. What I’d love to see especially (to mitigate the http://xkcd.com/1138/ problem) is an animated map showing surprising bursts of activity (something like Kleinberg’s Burst Detection algorithm, revealing sudden and unexpected spikes), rather than raw frequency counts. Also, there appears to be a bunch of inaccuracies in the basic geocoding – perhaps you can threshold all geocoded locations below a certain degree of certainty or ambiguity?
The concept is great, but without some semantic backing will be really difficult to mine with any automation support.
References to the Atlantic Ocean show up on a spot 1000 km west of the coast of Africa. There is a town in Nigeria called “Us Here”. Ellis Island references a place off Southern tip of Nunavut in the Labrador sea.
Some fusion with a text-only news feed to provide potential matches would greatly improve the robustness of the approach.
Big data will get there, and archiving is the necessary first step – please continue.
Pingback: HUFFPOLLSTER: Obamacare Support Stabilizes, But Is It Rebounding? | NewsCenterd
Pingback: HUFFPOLLSTER: Obamacare Support Stabilizes, But Is It Rebounding? | Both Sides Clash
Why are the big American nets and NYC stations not included: WCBS, WNBC, WABC, or ABC, NBC and CBS?
The Internet Archive’ television news research library presents news from the San Francisco and Washington DC metropolitan areas. Network national news programming is represented in their affiliate stations’ broadcasts in those regions. We are very interested expanding the collection to include local news from throughout the U.S.
Pingback: This Is What 400,000 Hours Of TV News Looks Like | Gizmodo Australia
Pingback: Data Viz News [39] | Visual Loop