Tag Archives: big data

A New Approach To Understanding War Through Television News: Introducing The TV News Visual Explorer & The Belarusian, Russian & Ukrainian TV News Archive

For more than 20 years, the Internet Archive’s Television News Archive has monitored television news, preserving more than 9.5 million broadcasts totaling more than 6.6 million hours from across the world, with a continuous archive spanning the past decade. Today just a small sliver of that archive is accessible to journalists and scholars due to the inaccessibility of video at this scale: fast forwarding through that much television news is simply beyond the ability of any human to make sense of. The small fraction of programs that contain closed captioning, speech recognition transcripts or OCR’d onscreen text can be keyword searched through the TV Explorer and TV AI Explorer, but for the majority of this global multi-decade archive, there has until now been no way for researchers to assess and understand the narratives of television news at scale, especially the visual landscape that distinguishes television from other forms of media and which is so central to understanding many of the world’s biggest stories from war to pandemics to the economy.

As the TV News Archive enters its third decade, it is increasingly exploring the ways in which it can preserve the domestic and international response to global events as it did with 9/11 two decades ago. As a first step towards this vision, over the last few months the Archive has preserved more than 46,000 broadcasts from domestic Belarusian, Russian and Ukrainian television news channels, including (in the order they were added to the Archive) Russia Today (part of the Archive since July 2010 but included in this collection starting January 1), Russian channels 1TV, NTV and Russia 1 (from March 26) and Russia 24 (from April 25), Ukrainian channel Espreso (from April 25) and Belarusian channel Belarus 24 (from May 16).

Why preserve television news coverage in a time of war? For journalists today it makes it possible to digest and report on how the war is being framed and narrated, with an eye towards how these narratives influence and shape popular support for the conflict and its potential future trajectory. For future generations of scholars, it makes it possible to look back at the contemporary information environment and prevailing public information, perspectives, and narratives.
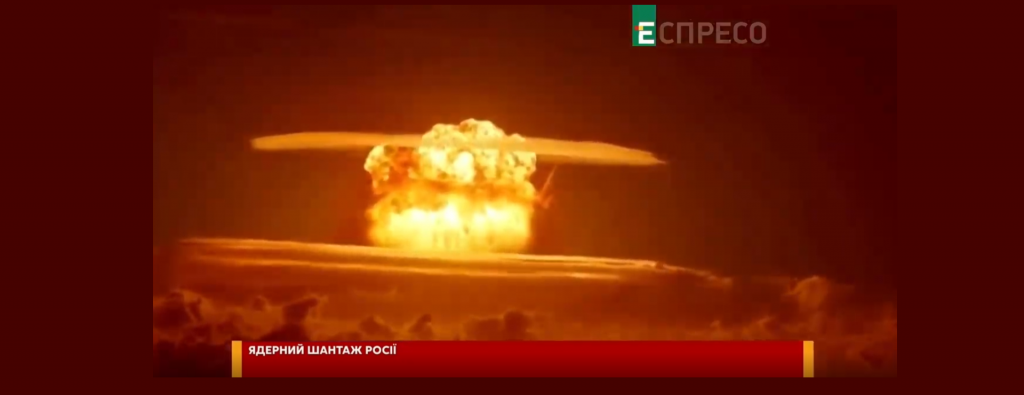
While there are myriad options for the general public to watch these channels today in realtime, there is no research-oriented archival interface designed for journalists and scholars to understand their coverage at the scale of days to months, to scan for key visuals and events and to comment, discuss and illustrate how nations are portraying major stories.

To address this critical need, today we are tremendously excited to unveil the Television News Visual Explorer, a collaboration of the GDELT Project, the Internet Archive’s Television News Archive and the Media-Data Research Consortium to explore new approaches to enabling rapid exploration and understanding of the visual landscape of television news.

The Visual Explorer converts each broadcast into a grid of thumbnails, one every 4 seconds, displayed in a grid six frames wide and scrolling vertically through the entire program, making it possible to skim an hour-long broadcast in a matter of seconds. Clicking on any thumbnail plays a brief 30 second clip of the broadcast at that point, making it trivial to rapidly triage a broadcast for key moments. The underlying thumbnails can even be downloaded as a ZIP file to enable non-consumptive computational analysis, from OCR to augmented search.

Machines today can catalog the basic objects and activities they see in video and generate transcripts of their spoken and written words, but the ability to contextualize and understand the meaning of all that coverage remains a uniquely human capability. No person could watch the entirety of the Archive’s 6.6 million hours of broadcasts, yet even just the 46,000 broadcasts in this new collection would be difficult for a single researcher to watch or even fast forward through in their entirety. Television’s linear format means coverage has historically been consumed a single moment at a time like a flashlight in a darkened warehouse. In contrast, this new interface makes it possible to see an entire broadcast all at once in a single display, making television news “skimmable” for the first time.

The Visual Explorer and this new research collection of Belarusian, Russian and Ukrainian television news coverage represent early glimpses into a new initiative reimagining how memory institutions like the Archive can make their vast television news archives more accessible to scholars, journalists and informed citizens. Beneath the simple and intuitive interface lies an immensely complex and highly experimental set of workflows prototyping both an entirely new scholarly and journalistic interface to television news and entirely new approaches to rapidly archiving international television coverage of global events.

Over the coming weeks, additional channels from the TV News Archive will become available through the new Visual Explorer, as well as a variety of experiments with the new lenses that tools like automatic transcription and translation can offer in helping journalists and scholars make sense of such vast realtime archives.

Get Started With The Television News Visual Explorer!

About Kalev Leetaru

For more than 25 years, GDELT’s creator, Dr. Kalev H. Leetaru, has been studying the web and building systems to interact with and understand the way it is reshaping our global society. One of Foreign Policy Magazine’s Top 100 Global Thinkers of 2013, his work has been featured in the presses of over 100 nations and fundamentally changed how we think about information at scale and how the “big data” revolution is changing our ability to understand our global collective consciousness.
Radio Ngrams Dataset Allows New Research into Public Health Messaging

Guest post by Dr. Kalev Leetaru

Radio remains one of the most-consumed forms of traditional media today, with 89% of Americans listening to radio at least once a week as of 2018, a number that is actually increasing during the pandemic. News is the most popular radio format and 60% of Americans trust radio news to “deliver timely information about the current COVID-19 outbreak.”

Local talk radio is home to a diverse assortment of personality-driven programming that offers unique insights into the concerns and interests of citizens across the nation. Yet radio has remained stubbornly inaccessible to scholars due to the technical challenges of monitoring and transcribing broadcast speech at scale.

Debuting this past July, the Internet Archive’s Radio Archive uses automatic speech recognition technology to transcribe this vast collection of daily news and talk radio programming into searchable text dating back to 2016, and continues to archive and transcribe a selection of stations through present, making them browsable and keyword searchable.

Ngrams data set

Building on this incredible archive, the GDELT Project and I have transformed this massive archive into a research dataset of radio news ngrams spanning 26 billion English language words across portions of 550 stations, from 2016 to the present.

You can keyword search all 3 million shows, but for researchers interested in diving into the deeper linguistic patterns of radio news, the new ngrams dataset includes 1-5grams at 10 minute resolution covering all four years and updated every 30 minutes. For those less familiar with the concept of “ngrams,” they are word frequency tables in which the transcript of each broadcast is broken into words and for each 10 minute block of airtime a list is compiled of all of the words spoken in those 10 minutes for each station and how many times each word was mentioned.

Some initial research using these ngrams

How can researchers use this kind of data to understand new insights into radio news?

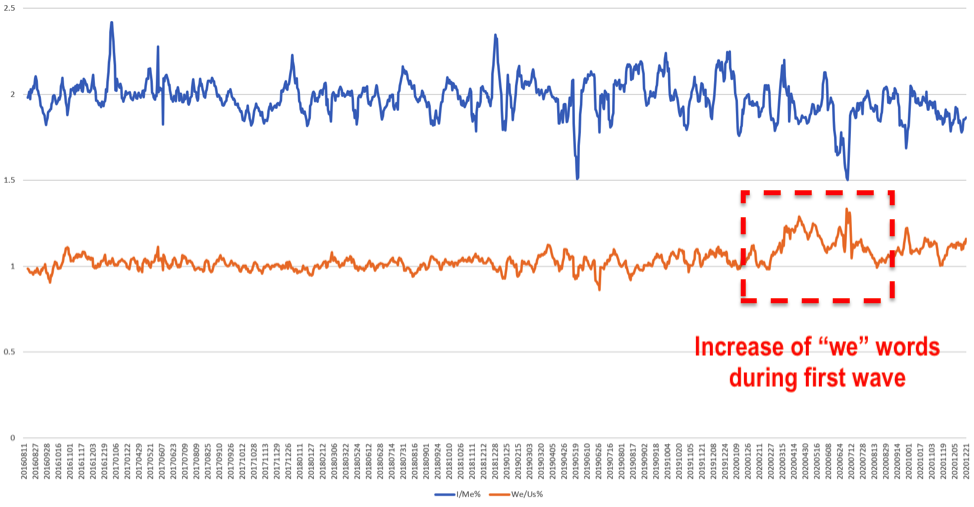
The graph below looks at pronoun usage on BBC Radio 4 FM, comparing the percentage of words spoken each day that were either (“we”, “us”, “our”, “ours”, “ourselves”) or (“i”, “me”, “i’m”). “Me” words are used more than twice as often as “we” words but look closely at February of 2020 as the pandemic began sweeping the world and “we” words start increasing as governments began adopting language to emphasize togetherness.

“We” (orange) vs. “Me” (blue) words on BBC Radio 4 FM, showing increase of “we” words beginning in February 2020 as Covid-19 progresses

TV vs. Radio

Combined with the television news ngrams that I previously created, it is possible to compare how topics are being covered across television and radio.

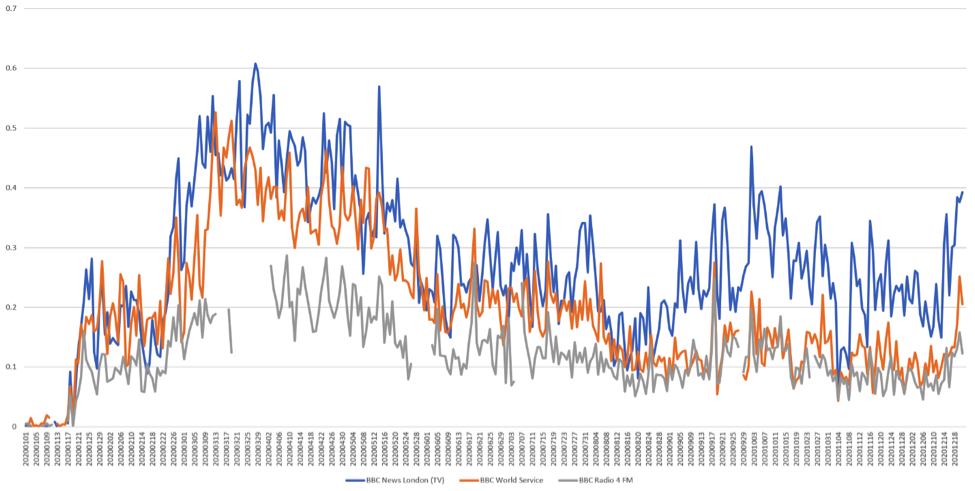
The graph below compares the percentage of spoken words that mentioned Covid-19 since the start of this year across BBC News London (television) versus radio programming on BBC World Service (international focus) and BBC Radio 4 FM (domestic focus).

All three show double surges at the start of the year as the pandemic swept across the world, a peak in early April and then a decrease since. Yet BBC Radio 4 appears to have mentioned the pandemic far less than the internationally-focused BBC World Service, though the two are now roughly equal even as the pandemic has continued to spread. Over all, television news has emphasized Covid-19 more than radio.  

Covid-19 mentions on Television vs. Radio. The chart compares BBC News London (TV) in blue, versus BBC World Service (Radio) in orange and BBC Radio 4 FM (Radio) in grey.

For now, you can download the entire dataset to explore on your own computer but there will also be an interactive visualization and analysis interface available sometime in mid-Spring.

It is important to remember that these transcripts are generated through computer speech recognition, so are imperfect transcriptions that do not properly recognize all words or names, especially rare or novel terms like “Covid-19,” so experimentation may be required to yield the best results.

The graphs above just barely scratch the surface of the kinds of questions that can now be explored through the new radio news ngrams, especially when coupled with television news and 152-language online news ngrams.

From transcribing 3 million radio broadcasts into ngrams to describing a decade of television news frame by frame, cataloging the objects and activities of half a billion online news images, to inventorying the tens of billions of entities and relationships in half a decade of online journalism, it is becoming increasingly possible to perform multimodal analysis at the scale of entire archives.

Researchers can ask questions that for the first time simultaneously look across audio, video, imagery and text to understand how ideas, narratives, beliefs and emotions diffuse across mediums and through the global news ecosystem. Helping to seed the future of such at-scale research, the Internet Archive and GDELT are collaborating with a growing number of media archives and researchers through the newly formed Media Data Research Consortium to better understand how critical public health messaging is meeting the challenges of our current global pandemic.

About Kalev Leetaru

For more than 25 years, GDELT’s creator, Dr. Kalev H. Leetaru, has been studying the web and building systems to interact with and understand the way it is reshaping our global society. One of Foreign Policy Magazine’s Top 100 Global Thinkers of 2013, his work has been featured in the presses of over 100 nations and fundamentally changed how we think about information at scale and how the “big data” revolution is changing our ability to understand our global collective consciousness.