Today the GDELT Project and the Internet Archive debut two exciting new interactive visualizations of the TV News Archive, one tracing the flow of money through campaign advertising in Philadelphia in the 2014 election cycle, and the other introducing a whole new way of tracing what “goes viral” on television by charting how the President’s 2015 State of the Union address was excerpted and discussed across American and select international television over the following two weeks.
Media & Money: Political Advertising in Philly’s 2014 Races
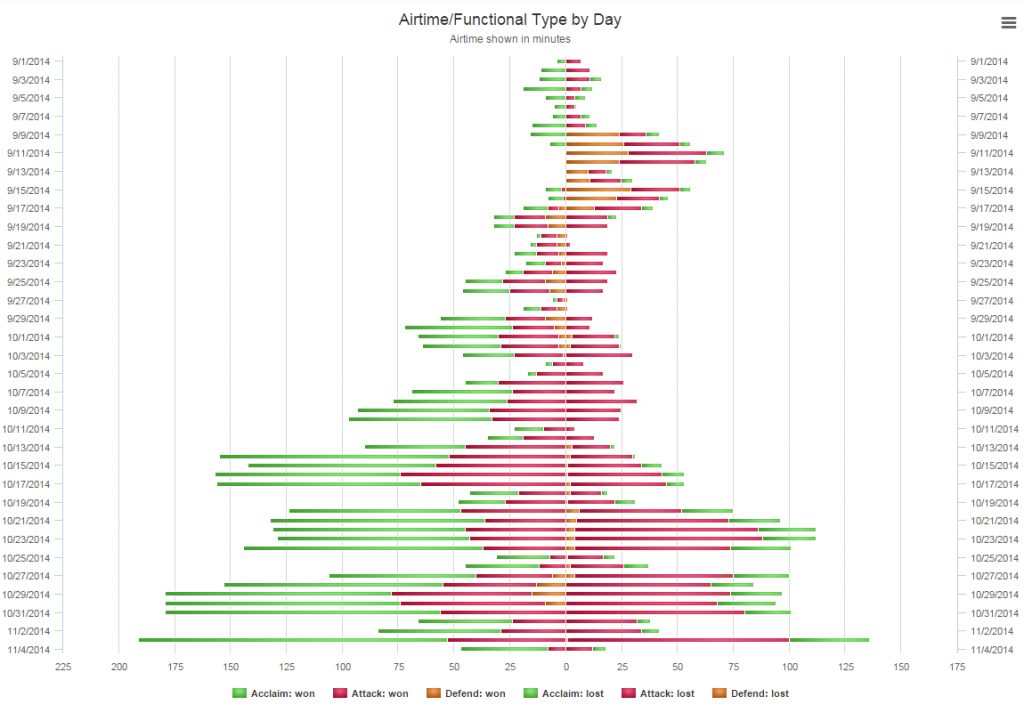
As part of the Philly Political Media Watch Project, from September 1, 2014 through the election of November 4, 2014, 7 television stations in the Philadelphia market were monitored to identify all politically-related advertisements. In all, 74 distinct political advertisements were identified which collectively aired 13,675 times during the 65 day monitoring period, with Archive staff scoring them for the time each devoted to supporting, attacking, and defending a candidate. A combination of human review and computerized analysis was used to identify every broadcast of each of the 74 ads over the 65 days, along with the sponsor paying for that particular airing. The end result is an interactive visualization that allows you to explore the television advertising landscape of Philadelphia last fall, comparing any pair of candidates, parties, races, status, win/lost, sponsor, sponsor type, television channel, or even keywords found in the transcripts, or any combination therein. The ability to exhaustively identify every single airing of a political advertisement during the key campaigning period and determine who paid for each broadcast offers an incredible new tool for understanding the impact of media and money in the political campaigning process.
For example, you can compare ads focusing on Tom Corbett that were paid by Tom Corbett for Governor vs those paid for by Tom Wolf for Governor. Or, compare all ads mentioning the two candidates from any sponsor. Or ads focusing on candidates that ultimately won vs lost. Or, compare the ads run by the Philadelphia Federation of Teachers vs those run by the House Majority PAC. Or, those mentioning “school” vs “job” in the transcript of the ad. Or, simply, view the overall trends for all 13,675 advertisement airings.
A New Approach to Measuring Virality on Television: State of the Union 2015
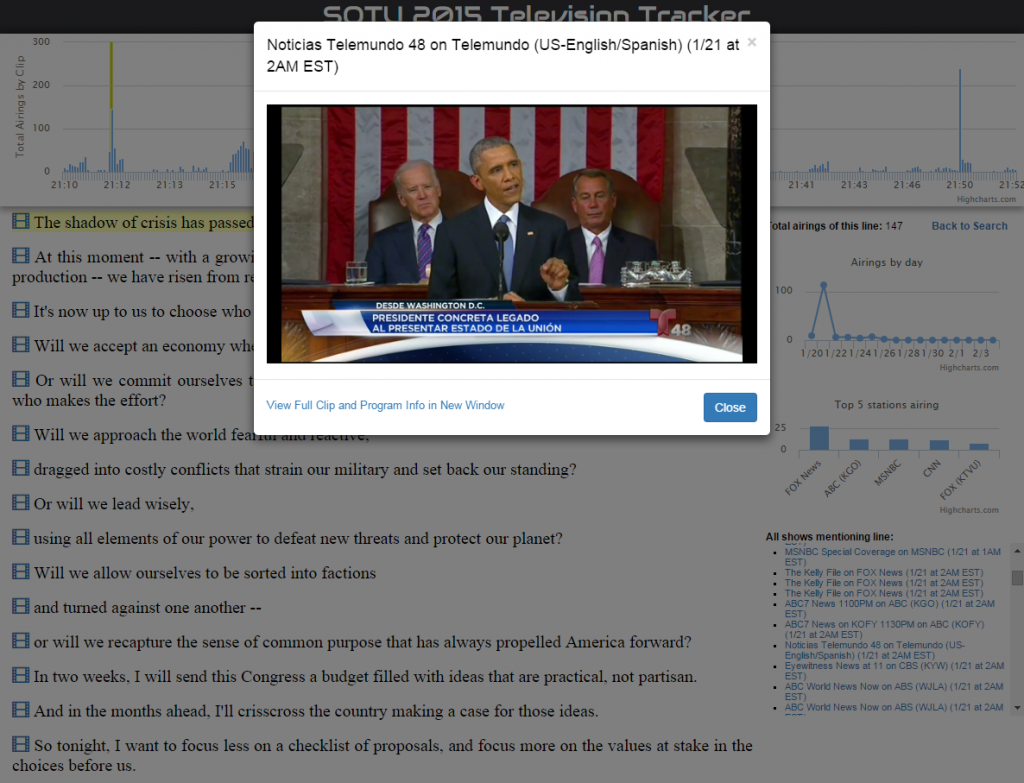
Turning from local to national television, the second visualization explores how American and select international television excerpted and discussed the President’s January 20, 2015 State of the Union (SOTU) speech. The social media era has profoundly altered the political communications landscape, ushering in a fixation on tracking emerging political “memes” and which pieces of political discourse are “going viral” at the moment. Yet, we lack metrics for measuring what “goes viral” on television – a critical gap considering that television is still a dominate source of political news for 37% to 60% of Americans. Thus, the “State of the Union 2015: Tracking ‘Going Viral’ on Television” project was born to prototype a brand-new way of tracking “memes” on television – the ability to take a speech or other television show, select a short clip of it, and instantly see every instance of that clip that was aired anywhere across the landscape of the world’s television monitored by the Archive.
Using the audfprint tool developed by Dan Ellis at the Laboratory for the Recognition and Organization of Speech and Audio at Columbia University, the 2015 State of the Union speech was broken into sentence-long soundbites, with each soundbite scanned against all news television shows archived by the Internet Archive from the evening of the January 20, 2015 speech through February 4, 2015 (two weeks later). The non-commercial audfprint tool scans the audio track of each show, so it is not dependent on closed captioning, which is extremely noisy and entirely absent from many foreign language broadcasts. The tool is also extremely sensitive, able to detect brief excerpts even when they are overdubbed by a commentator and/or other sound effects. In total, 13,082 news shows totaling 649 hours of programming were scanned, and excluding “gavel-to-gavel” coverage (broadcasting the entire speech from start to finish), 208 distinct shows played an excerpt from the speech over 524 broadcasts. An interactive visualization allows you to scroll through the speech passage by passage to see how each was excerpted and discussed and you can even watch short preview clips of each mention.
What you are seeing here is a first glimpse of a whole new way of exploring television, using enormously powerful computer algorithms as a new lens through which to explore the Internet Archive’s massive archive of television news.