Tag Archives: political ads

Expanding the Television Archive

When we started archiving television in 2000, people shrugged and asked, “Why?  Isn’t it all junk anyway?” As the saying goes, one person’s junk is another person’s gold. From 2010-18, scholars, pundits and above all, reporters, have spun journalistic gold from the data captured in our 1.5 million hours of television news recordings. Our work has been fueled by visionary funders(1) who saw the potential impact of turning television – from news reports to political ads – into data that can be analyzed at scale. Now the Internet Archive is taking its Television Archive in new directions. In 2018 our goals for television will be: better curation in what we collect; broader collection across the globe; and working with computer scientists interested in exploring our huge data sets. Simply put, our mission is to build and preserve comprehensive collections of the world’s most important television programming and make them as accessible as possible to researchers and the general public. We will need your help.  

“Preserving TV news is critical, and at the Internet Archive we’ve decided to rededicate ourselves to growing our collection,” explained Roger MacDonald, Director of Television at the Internet Archive. “We plan to go wide, expanding our archives of global TV news from every continent. We also plan to go deep, gathering content from local markets around the country. And we plan to do so in a sustainable way that ensures that this TV will be available to generations to come.”

Libraries, museums and memory institutions have long played a critical role in preserving the cultural output of our creators. Television falls within that mandate. Indeed some of the most comprehensive US television collections are held by the Library of Congress, Vanderbilt University and UCLA. Now we’d like to engage with a broad range of libraries and memory institutions in the television collecting and curation process. If your organization has a mandate to collect television or researcher demand for this media, we would like to understand your needs and interests. The Internet Archive will undertake collection trials with interested institutions, with the eventual goal of making this work self-sustaining.

Simultaneously, we are looking to engage researchers interested in the non-consumptive analysis of television at scale, in ways that continue to respect the interests of right holders. The tools we’ve created may be useful. For instance, we hope the tools the Internet Archive used to detect TV campaign ads can be applied by researchers in new and different ways.  If your organization has interest in computing with television as data at large, we are interested in working with you.

This groundbreaking interface for searching television news, based on the closed captions associated with US broadcasts, was developed between 2009-2012.

A brief history of the Internet Archive’s Television collection:

2000 Working with pioneering engineer, Rod Hewitt, IA begins archiving 20 channels originating from many nations.

Oct. 2001 September 11, 2001 Collection established, and enhanced in 2011.

2009-2012 With funding from the Knight Foundation and many others, we built a service to allow public searching, citation and borrowing of US television news programs on DVD.

2012-2014 Public TV news library launched with tools to search, quote and share streamed snippets from television news.

2014 Pilot launched to detect political advertisements broadcast in the Philadelphia region, led to developing open sourced audio fingerprinting techniques.

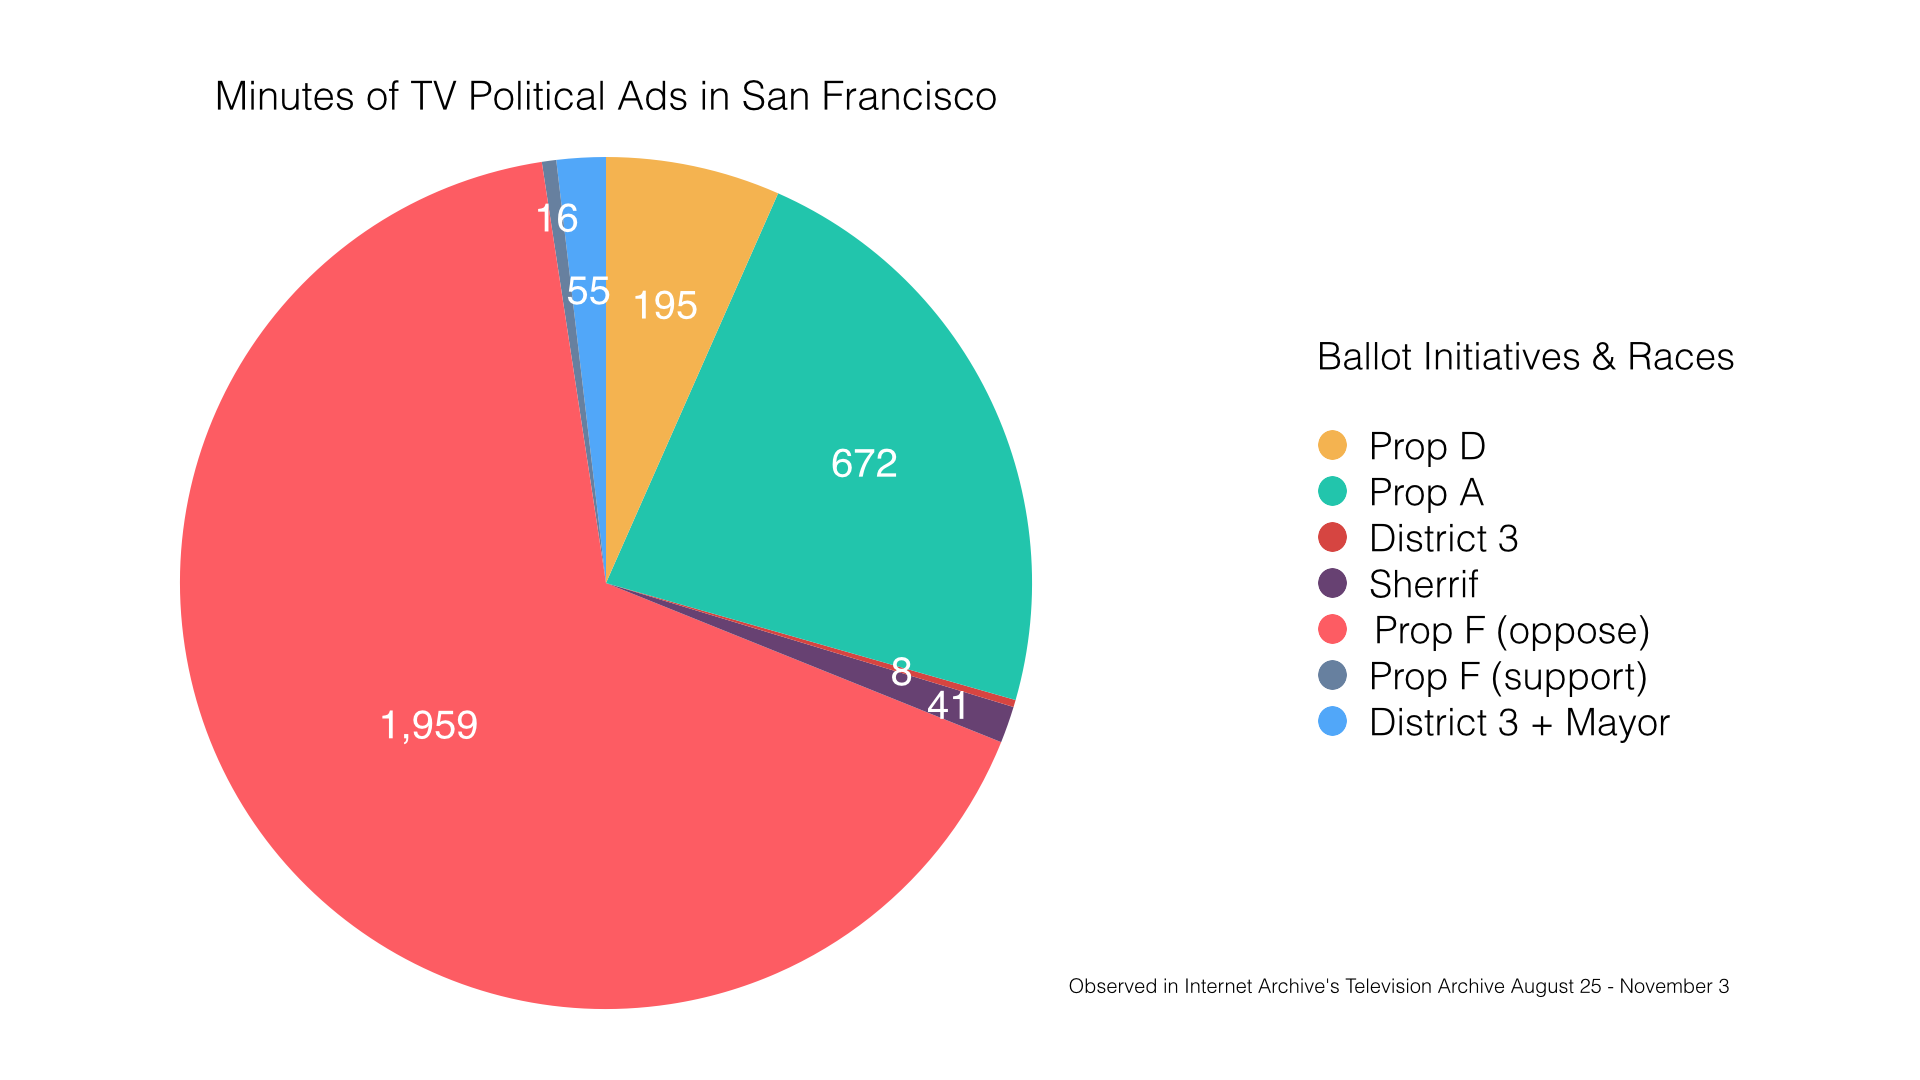
2016 Political ad detection, curation, and access expanded to 28 battleground regions for 2016 elections, enabling journalists to fact check the ads and analyze the data at scale. The same tools helped reporters analyze presidential debates.  This resulted in front-page data visualizations in The New York Times, as well as 150+ analyses by news outlets from Fox News to The Economist to FiveThirtyEight.

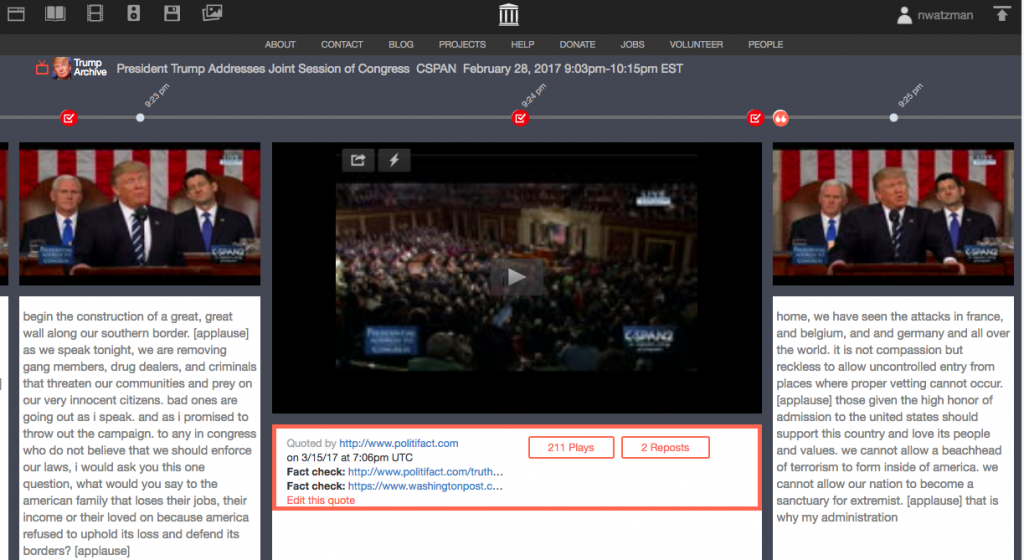
2017-date Experiments with artificial intelligence techniques to employ facial identification, and on-screen optical character recognition to aid searching and data mining of television. Special curated collections of top political leaders and fact-check integrations.

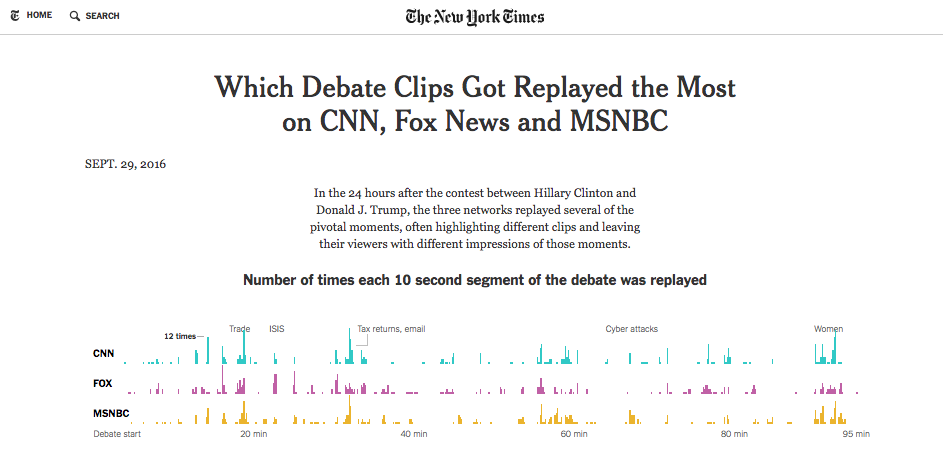
In the run-up to the 2016 presidential elections, journalists at the NYT and elsewhere began analyzing television as data, in this case looking at the different sound bites each network chose to replay.

Embarking on a new direction also means shifting away from some of our current services. Our dedicated television team has been focusing on metadata enhancement and assisting journalists and scholars to use our data. We will be wrapping up some of these free services in the next three to four months.  We hope others will take up where we left off and build the tools that will make our collection even more valuable to the public.

Now more than ever in this era of disinformation, our world needs an open, reliable, canonical reference source of television news. This cannot exist without the diligent efforts of technologists, journalists, researchers, and television companies all working together to create a television archive open for all. We hope you will join us!

To learn more about the work of the TV News Archive outreach and metadata innovation team over the last few years, please see our blog posts.

(1) Funding for the Television Archive has come from diverse donors, including the John S. and James L. Knight Foundation, Democracy Fund, Rita Allen Foundation, craigslist Charitable Fund and The Buck Foundation.

The tech powering the Political TV Ad Archive

Ever wonder how we built the Political TV Ad Archive? This post explains what happens back stage — how we are using advanced technology to generate the counts for how many times a particular ad has aired on television, where, and when, in markets that we track.

There are three pieces to the Political TV Ad Archive:

  • The Internet Archive collects, prepares, and serves the TV content in markets where we have feeds. Collection of TV is part of a much larger effort to meet the organization’s mission of providing “Universal Access to All Knowledge.”The Internet Archive is the online home to millions of free books, movies, software, music, images, web pages and more.
  • The Duplitron 5000 is our whimsical name for an open source system responsible for taking video and creating unique, compressed versions of the audio tracks. These are known as audio fingerprints. We create an audio fingerprint for each political ad that we discover, which we then match against our incoming stream of broadcast television to find each new copy, or airing, of that ad. These results are reported back to the Internet Archive.
  • The Political TV Ad Archive is a WordPress site that presents our data and our videos and presents it to the rest of the world. On this website, for the sake of posterity, we also archive copies of political ads that may be airing in markets we don’t track, or exclusively on social media. But for the ads that show up in areas where we’re collecting TV, we are able to present the added information about airings.


Step 1: recording television

We have a whole bunch of hardware spread around the country to record television. That content is then pieced together to form the programs that get stored on the Internet Archive’s servers. We have a few ways to collect TV content. In some cases, such as the San Francisco market, we own and manage the hardware that records local cable. In other cases, such as markets in Ohio and Iowa, the content is provided to us by third party services.

Regardless of how we get the data, the pipeline takes it to the same place. We record in minute-long chunks of video and stitch them together into programs based on what we know about the station’s schedule. This results in video segments of anywhere from 30 minutes to 12 hours. Those programs are then turned into a variety of file formats for archival purposes.

The ad counts we publish are based on actual airings, as opposed to reported airings. This means that we are not estimating counts by analyzing Federal Election Commission (FEC) reports on spending by campaigns. Nor are we digitizing reports filed by broadcasting stations with the Federal Communications Commission (FCC) about political ads, though that is a worthy goal. Instead we generate counts by looking at what actually has been broadcast to the public.

Because we are working from the source, we know we aren’t being misled. On the flip side, this means that we can only report counts for the channels we actively track and record. In the first phase of our project, we tracked more than 20 markets in 11 key primary states (details here.) We’re now in the process of planning which markets we’ll track for the general elections. Our main constraint is simple: money. Capturing TV comes at a cost.

A lot can go wrong here. Storms can affect reception, packets can be lost or corrupted before they reach our servers. The result can be time shifts or missing content. But most of the time the data winds up sitting comfortably on our hard drives unscathed.

Step 2: searching television

Video is terrible when you’re trying to look for a specific piece of it. It’s slow, it’s heavy, it is far better suited for watching than for working with, but sometimes you need to find a way.

There are a few things to try. One is transcription; if you have a time-coded transcript you can do anything. Like create a text editor for video, or search for key phrases, like “I approve this message.”

The problem is that most television is not precisely transcribed. Closed captions are required for most U.S. TV programs, but not for advertisements. Shockingly, most political ads are not captioned. There are a few open source tools out there for automated transcript generation, but the results leave much to be desired.

Introducing audio fingerprinting

We use a free and open tool called audfprint to convert our audio files into audio fingerprints.

An audio fingerprint is a summarized version of an audio file, one that has removed everything except the most interesting pieces of every few milliseconds. The trick is that the summaries are formed in a way that makes it easy to compare them, and because they are summaries, the resulting fingerprint is a lot smaller and faster to work with than the original.

The audio fingerprints we use are based on a thing called frequency. Sounds are made up of waves, and each wave repeats–oscillates–at different rates. Faster repetitions are linked to higher sounds, lower repetitions are lower sounds.

An audio file contains instructions that tell a computer how to generate these waves. Audfprint breaks the audio files into tiny chunks (around 20 chunks per second) and runs a mathematical function on each fragment to identify the most prominent waves and their corresponding frequencies.

The rest is thrown out, the summaries are stored, and the result is an audio fingerprint.

If the same sound exists across two files, a common set of dominant frequencies will be seen in both fingerprints. Audfprint makes it possible to compare the chunks between two sound files, count how many they have in common, and how many appear in roughly the same distance from one another.

This is what we use to find copies of political ads.

Step 3: cataloguing political ads

When we discover a new political ad the first thing we do is register it on the Internet Archive, kicking off the ingestion process. The person who found it types in some basic information such as who the ad mentions, who paid for it, and what topics are discussed.

The ad is then sent to the system we built to manage our fingerprinting workflow, we whimsically call the Duplitron 5000—or the “DT5k.” This uses audfprint to generate fingerprints, organizes how the fingerprints are stored, process the comparison results, and allows us to scale to process across millions of minutes of television.

DT5k generates a fingerprint for the ad, stores it, and then compares that fingerprint with hundreds of thousands of existing fingerprints for the shows that had been previously ingested into the system. It takes a few hours for all of the results to come in. When they do, the Duplitron makes sense of the numbers and tells the archive which programs contain copies of the ad and what time the ad aired.

These result end up being fairly accurate, but not perfect. The matches are based on audio, not video, which means we face trouble when the same soundtrack is used in a political ad as has been used in, for instance, an infomercial.

We are working on improving the system to filter out these kinds of false positives, but even with no changes these fingerprints have provided solid data across the markets we track.

Duplitron

The Duplitron 5000, counting political ads. Credit: Lyla Duey.

Step 4: enjoying the results

And so you understand a little bit more about our system. You can download our data and watch the ads at the Political TV Ad Archive.  (For more on our metadata–what’s in it, and what can you can do with it, read here.)

Over the coming months we are working to make the system more accurate. We are also exploring ways to identify newly released political ads without any need for manual entry.

P.S. We’re also working to make it as easy as possible for any researchers to download all of our fingerprints to use in their own local copies of the Duplitron 5000. Would you like to experiment with this capability? If so, contact me on Twitter at @slifty.

Pro-Airbnb advertising dominated recent political TV ads in San Francisco

Based on algorithmic analysis, Pro-Airbnb advertising dominated political TV ads in San Francisco in the weeks leading up to Election Day. Two thirds of the minutes devoted to political ads on several initiatives and races before voters focused on arguments against a proposal to curb the company’s operations in the city, according to a review of the Internet Archive television archive. Voters ended up rejecting Proposition F, whose opponents claimed it would encourage neighbors to spy on each other and increase lawsuits, by a margin of 55 to 45 percent.

Minutes of TV Political Ads in San Francisco

The Archive identified total of 1,959 minutes of ads (4,591 plays) opposing Proposition F, out of 2,895 minutes devoted to all political TV ads, or roughly two thirds of the air-time.

To put that in perspective, Mayor Ed Lee, who won his reelection easily, was the subject of only 55 minutes of ads. Though he appeared in and narrated hundreds of ads supporting Propositions A and D, the only ads that mention his mayoral race were airings of a support ad paid for not by his own campaign, but rather by an independent expenditure from Clint Reilly, a local real estate developer and former professional political consultant.

Samples of all ads found to be related to 2015 San Francisco elections can be viewed here, and metadata about those that occurred in archived television can be downloaded from this page.

The only political ad that aired on television in support of proposition F was this one, which was observed for a total of 16 minutes between October 16th to 25th. The ad, which features a parody of the Eagles’ song “Hotel California,” was pulled from Youtube and the ShareBetterSF campaign website because of claims of copyright infringement. Dale Carlson, a spokesman for the campaign who contacted the Archive, wrote “We believe the ad is parody and did not constitute a copyright violation. But it had already run its course and we weren’t going to spend money on legal bills to defend an ad that was already off the air.”

In all, the Archive identified 14 unique ads opposing Proposition F that aired on TV. In the final days of the campaign, the opponents devoted airtime to this ad that calls the proposal “too extreme,” quotes from the San Francisco Chronicle, and cites high profile opponents such as Lt. Gov. Gavin Newsom, Mayor Lee. This 30-second ad aired 423 times on 10 channels in San Francisco (CNBC, CNN, FOXNEWS, KGO, KNTV, KOFY, KPIX, KRON, KTVU, MSNBC).

This review updates an earlier one issued last week focused exclusively on Airbnb ads, broadening the analysis to include all political TV ads aired from August 25th through November 3.  The Archive identified ads through a number of sources, including SFGov’s Summary of Third Party Expenditures Regarding San Francisco Candidates hosted by the City of San Francisco. An audio fingerprint was created for each ad and used to find matches in some 35,000 hours of archived local station programming and cable news network shows available in the San Francisco region.  The Internet Archive’s television news research library presents public opportunities to search, compare and contrast news programs in its archive.  Entertainment programming is only available for select algorithmic study within its server environment.

The Internet Archive’s review of political TV ads relating to Proposition F is part of experimentation in preparation for our new Knight Foundation funded project to track political TV ads in key primary states. Stay tuned for news about our December launch.

Research by Trevor von Stein

Pro-Airbnb political TV ads air at rate of 100:1 as San Franciscans head to polls

For every one minute of political ads aired in favor of a contentious ballot initiative intended to further regulate Airbnb’s growing presence in the city where it is headquartered, more than 100 minutes of ads urging them to vote “no,” have aired on local San Francisco area TV stations, according to an assessment of the Internet Archive’s television archive.

Audio fingerprinting of YouTube-hosted advertising was used to identify the same ads in local station programming and cable news networks available in the region, from August 25th through October 26th.  Sample ads can be viewed here, and metadata about their occurrences can be downloaded from this page.

Proposition F, which is backed by a coalition of unions, land owners, housing advocates, and neighborhood groups, would restrict private rentals to 75 nights per year as well as enact rules that would ensure that hotel taxes are paid and city code followed. It would also allow private party lawsuits by neighbors against private renters suspected of violating the law.

The Internet Archive found just one TV ad favoring the initiative, also appeared on the Proposition F campaign website. The Archive discovered 32 instances of this ad airing on local TV stations, for a total of 16 minutes of airplay. However, the ad, which features a parody of the song “Hotel California,” by the Eagles, (the lyrics were replaced with “Hotel San Francisco,”) was recently removed from the official website because of a claim of copyright infringement.

In contrast, in our sample range, Airbnb supporters aired more than 26 hours of ads against the initiative. One example ad, which is below, claims that the initiative would “encourage neighbors to spy on each other,” and “create thousands of new lawsuits.” This ad played at least 358 times in recent weeks, for a total of 179 minutes of airtime.

Over all, according to reports filed with the San Francisco Ethics Commission, opponents of Proposition F have reported spending $6.5 million compared to $256,000 from organizations supporting the initiative.

Of course the ad campaigns are not just limited to television. Airbnb apologized last week after it caught flack for a series of controversial bus stations and billboard ads that critics called “passive aggressive” and “whiny,”  for complaining about how public institutions, such as libraries, spent their tax revenue-derived budgets.

But TV remains a key way that political operators try to influence voters. As Nate Ballard, a Democratic strategist recently said on a local newscast: “That’s how you win campaigns in California, on TV.”

The Internet Archive’s review of political TV ads relating to Proposition F is part of experimentation in preparation for our new Knight Foundation funded project to track political TV ads in key primary states. Stay tuned for news about our December launch.

research by Trevor von Stein


Get your Dem debate visualizations here

Hot off the internet presses, here is media analyst’s Kalev Leetaru’s visualization tool, fueled by Internet Archive data, which enables users to trace particular phrases used in broadcast news coverage in the first 24 hours after would-be presidential nominees appeared in the first Democratic debate of the 2016 election.

Scroll down and what sticks out immediately are the two subjects that captured most of the news broadcasters’ attention: “Bernie Sanders’ “damn emails” quote and guns.

When the subject came up of the controversy over Clinton’s decision to do public work from a private email server, rather than attack Clinton, Sanders defended her:

“Let me say — let me say something that may not be great politics. But I think the secretary is right, and that is that the American people are sick and tired of hearing about your damn e-mails.”

According to Internet Archive data, that sound bite aired 496 times across stations.

The other issue that grabbed attention was gun violence: Sanders, who hails from gun-friendly rural Vermont, was called to task for his vote to make it tougher to hold gun manufacturers liable when the guns they make are used in a crime. Answering a question by CNN moderator Anderson Cooper, on whether Sanders is tough enough on guns, Clinton said:

“No, not at all. I think that we have to look at the fact that we lose 90 people a day from gun violence. This has gone on too long and it’s time the entire country stood up against the NRA. The majority of our country…(APPLAUSE)… supports background checks, and even the majority of gun owners do.”

This clip aired 260 times across stations.

However, these are just the top take-aways from this massive data crunching tool. It provides a search mechanism for the user to do deeper dives into the data and discover trends across and within certain types of news broadcasts.

Leetaru’s own analysis is here, on the Washington Post’s Monkey Cage. Among his observations:

There was also variation in how much attention each network paid to each candidate (you can see for yourself using the interactive visualization). Telemundo favored Sanders with 41 percent, followed by O’Malley with 24 percent and Clinton at just 21 percent, though admittedly, they broadcast a relatively small number of excerpts. FOX Business also favored Sanders 50 percent to Clinton’s 38 percent, as did CSPAN with Sanders at 52 percent to Clinton’s 44 percent. All other networks favored Clinton, though sometimes by a relatively close margin — like CNBC (50 percent Clinton to 43 percent Sanders) or PBS affiliates (41 percent Clinton to 38 percent Sanders).

This tool is also part of the Internet Archive’s testing of technology that we’ll use in our new Knight Foundation funded project to track political TV ads in key primary states, which will launch in early December.

Dig in and have fun.

As Democratic candidates debate, Internet Archive will be gathering data

When Hillary Clinton and Bernie Sanders take the podium tonight along with other contenders for the Democratic presidential nomination in 2016, their debate will be televised. The Television Archive will be tracking the news coverage surrounding the debate, viewable and searchable, here.

And this tool, developed by political scientist Kalev Leetaru  and fueled by Internet Archive data, allows users to see how many times a particular candidate’s name is mentioned in news coverage. Going into the debate, Hillary Clinton is getting more than twice as mentions as Sen. Bernie Sanders.

We take for granted that candidates will debate on screen, but it wasn’t always so. The faceoff between Republican Vice President Richard Nixon and Democrat U.S. Senator Jack Kennedy in 1960, 55 years ago last month, marked the first time that Americans were able to watch candidates for the nation’s highest office from the comfort of their living rooms. You can see part one of the debate here, preserved on the Archive’s servers:

The received wisdom about this famous debate was that, from this point on, candidates had to think not just about what they said on the campaign stump, but how they looked. This could make a huge difference in how the public and the media perceived who “won” the debate. Nixon looked tired and like he needed a shave. Kennedy looked healthy and vibrant. Those who listened on the radio thought Nixon won.

“It’s one of those unusual points in the timeline of history where you say things changed very dramatically–in this case, in a single night,” Alan Schroeder, a media historian and associate professor at Northeastern University, told Time Magazine in 2010.

Here’s part II of the Kennedy-Nixon 1960 debate:

We don’t know yet who the perceived winner of tonight’s debate will be. The Internet Archive’s data will provide one way to evaluate this. Stay tuned.